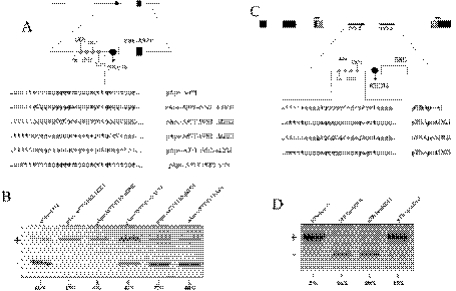
Figure 3.
A G-rich sequence within the human apoA-II intron 2 influences exon 3 splicing according to context. (A) Schematic representation of the different constructs carrying point mutations in a regulatory sequence within the intron 2 in the pApo gene context. White boxes, thin lines and the black circle represent the human apoA-II exons, introns and the (GT)16 tract, respectively. The ESEA97T is indicated as small black box within the apoA-II exon 3. Sequences within the apoA-II intron 2 changed by site-directed mutagenesis are indicated by small, white and gray circles. Partial sequence of the different constructs carrying point mutations in the intron 2 used for transfection in Hep3B cell line. (B) Agarose gel electrophoresis of RT–PCR products derived from constructs with single G runs or T run disruption in the pApo context. (C) Schematic representation of the different constructs carrying point mutations within the intron 2 of the apoA-II in pTB context. α-globin, fibronectin EDB exons and human apoA-II exon 3 are indicated in black, shaded and white boxes, respectively. Solid black lines, white box and black circle represent the human apoA-II introns, exon 3 and the (GT)16 tract, respectively. The ESEwt is represented by a small white box inside the exon 3. Mutated nucleotides within the apoA-II intron 2 are indicated by small white and gray circles. Partial sequence of the different constructs carrying disrupting point mutations within intron 2. (D) Splicing pattern analysis by ethidium bromide staining of a 2% agarose gel electrophoresis of the RT–PCR products derived from constructs carrying single G run disruption in the pTB context. Relative amounts of exon 3 skipping are indicated below the lane numbers. The variability among three different experiments was always <20%.

