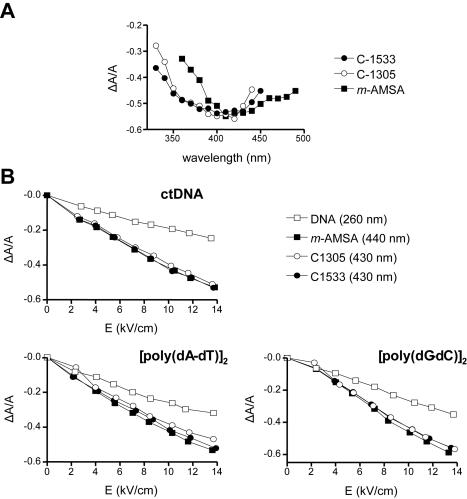
Figure 4.
ELD data for drug binding to DNA. Dependence of the reduced dichroism ΔA/A on the wavelength (A) and electric field strength (B) for DNA (open square), m-AMSA (closed square) and triazoloacridone derivatives C-1305 (open circle) and C-1533 (closed circle). Conditions: 13.6 kV/cm, P/D = 20 (200 µM DNA and 10 µM drug) (A) and ΔA/A was measured in absorption band of 440 nm for the DNA–amsacrine complexes (P/D = 20), 430 nm for the DNA–triazoloacridone derivative complexes (P/D = 20) and 260 nm for the DNA alone (B). All measurements were performed in 1 mM sodium cacodylate buffer, pH 7.0.

