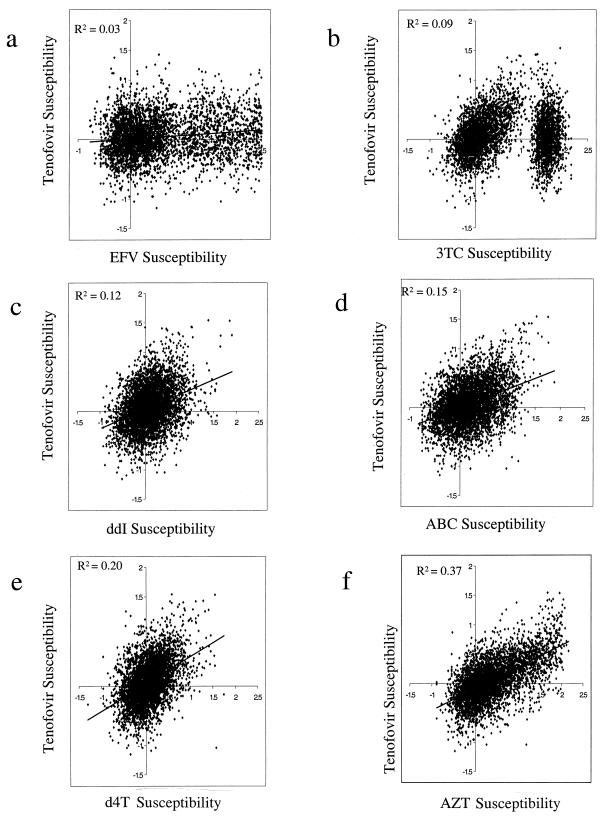
FIG. 3.
Linear regression analyses of cross-resistance profiles of HIV-1 isolates obtained from individuals undergoing routine drug resistance testing. Tenofovir susceptibility as determined using the Antivirogram recombinant phenotypic assay is indicated on a log-log scale as a function of susceptibility to efavirenz (EFV) (a), 3TC (b), didanosine (c), ABC (d), d4T (e), and AZT (f). Note that the regression line is deliberately omitted in panel b, due to the observation of two distinct populations. Also note that, if the highly 3TC-resistant isolates (represented by the population on the right in panel b) are excluded from the analysis, the correlation between 3TC and tenofovir becomes stronger (r2 = 0.23).

