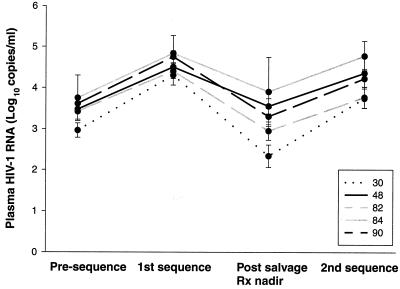
FIG. 2.
Plasma HIV-1 RNA levels (log10 copies per milliliter, means ± standard errors) from 68 of 78 patients, including 29 of 33 presenting with L90M, 19 of 21 presenting with V82A/F/T, 13 of 16 presenting with D30N, 4 of 5 presenting with G48V, and 3 of 3 presenting with I84V. “Presequence” indicates the lowest plasma RNA levels in the year (median, 6 months) before the first sequence. “1st sequence” indicates the RNA levels at the time of the first sequence (i.e., that containing a single primary drug resistance mutation). “Post salvage Rx nadir” indicates the lowest plasma HIV-1 RNA levels between the first and second sequences (median, 6 months after the first sequence). “2nd sequence” indicates the plasma HIV-1 RNA levels at the time of the second sequence.

