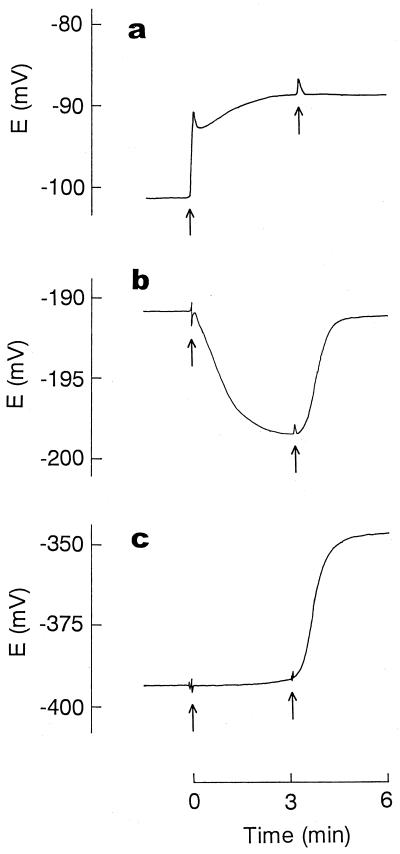
FIG. 3.
Ca2+ release (a), TPP+ uptake (b), and K+ efflux (c) induced by PMBN. For the measurement of Ca2+ release (a), E. coli cells were suspended in a solution (1 ml) containing 100 mM choline chloride, 10 mM Tris-lactate, and 50 mM MOPS-Tris (pH 7.2) at 0.6 mg of cell protein/ml. TPP+ uptake (b) and K+ efflux (c) were measured simultaneously. In this case, E. coli cells were suspended at the concentration used for the Ca2+ release measurement in an assay solution (2 ml) containing 100 mM choline chloride, 10 mM Tris-lactate, 50 mM MOPS-Tris (pH 7.2), and 10 μM TPPCl. At the time indicated by the first arrow, PMBN was added at a final concentration of 100 μM. The second arrow indicates when melittin was added at a final concentration of 20 μM.

