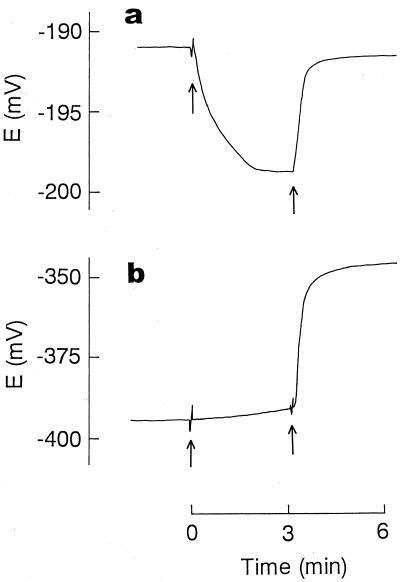
FIG. 6.
TPP+ uptake (a) and K+ release (b) induced by methoctramine. Assay conditions were the same as for Fig. 3. At the time indicated by the first arrow, methoctramine was added at a final concentration of 100 μM. The second arrow indicates when melittin was added at a final concentration of 20 μM.

