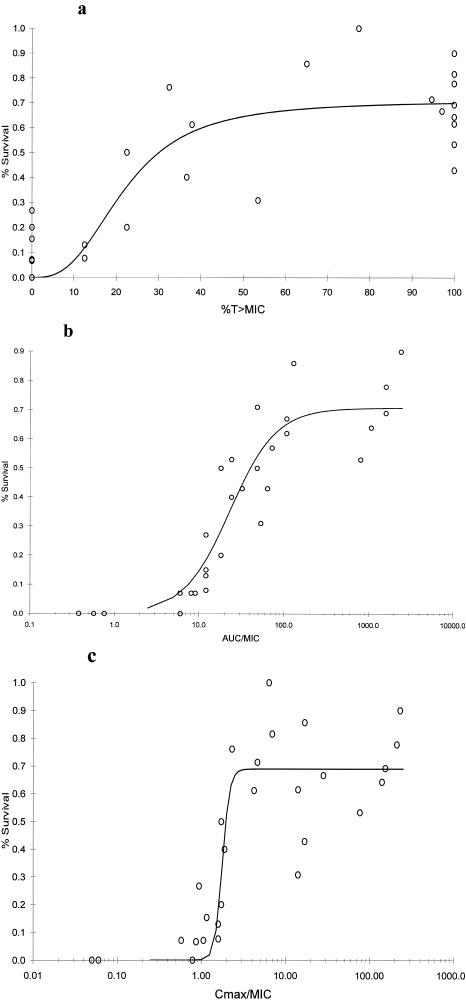
FIG. 3.
Cumulative %S for seven S. pneumoniae strains over 120 h versus %T>MIC (r2 = 0.90) (a), AUC0-24/MIC (r2 = 0.92) (b), and Cmax/MIC (r2 = 0.89) (c). Each point (n = 36) represents 5 to 10 mice (controls) or 14 or 15 mice (treatment groups); data for controls and treatment groups with mean AUC0-24/MIC or Cmax/MIC values of 0.0 are not shown (range, 0 to 30%).

