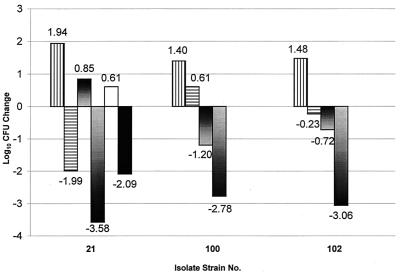
FIG. 7.
Mean change in log10 CFU in lung tissue at 24 h after CLR (150 mg/kg BID), shown by bars (left to right for each strain), in immunocompromised ICR mice (n = 4), ICR untreated controls (n = 4), immunocompetent CBA/J mice (n = 6 to 10), and CBA/J untreated controls (n = 4 to 6). The black bar and white bar represent the immunocompromised CBA/J mice at 24 h after CLR (150 mg/kg BID; n = 5) and untreated controls (n = 5), respectively.

