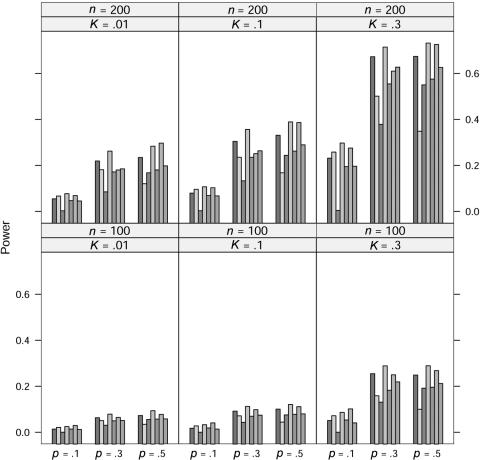
Figure 8.
Power comparison for the dichotomous trait when the generating model is multiplicative. The significance level is 0.001. Half of the sample is cases, and the other half is controls. The order of statistics (shaded bars) is (from left to right): ΛNew, ΛDom, ΛRec, ΛAdd, ΛLarger, ΛLargest, and ΛUnc.

