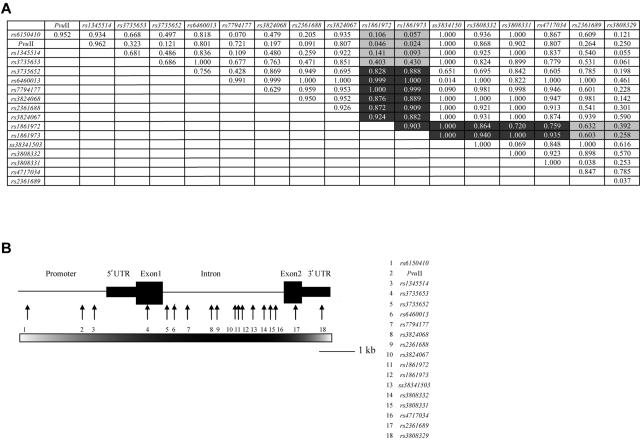
Figure 2.
Intermarker LD values. A, Tabular representation of the pairwise LD (D′) values between the 18 polymorphisms tested for association in the AGRE I data set. The LD relationships of each polymorphism with rs1861972 and rs1861973 are highlighted, with the degree of shading corresponding to the strength of LD: black indicates strong LD (D′ > 0.72); gray indicates intermediate/weak LD (D′ range 0.024–0.632). B, The EN2 gene is illustrated with the position of all 18 tested polymorphisms demarcated by arrows. The decay of LD of each polymorphism with respect to rs1861972 and rs1861973 is represented by a gradient bar drawn below the gene. The degree of shading corresponds to the strength of LD, as described above. Only intronic polymorphisms are in strong LD with rs1861972 and rs1861973.

