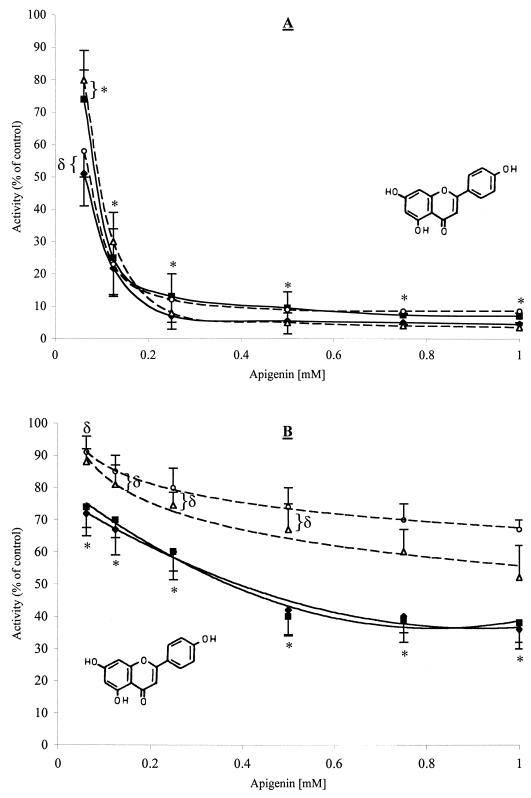
FIG. 1.
Effects of apigenin on the activities of streptococcal GTFs in solution (A) and adsorbed onto an sHA surface (B). Symbols: ♦, GTF B; ▪, GTF C; ▵, GTF D; ○, GTF Ss. The data shown are mean values ± standard deviations. Percent inhibition was calculated by considering the control (DMSO-ethanol; final concentrations of 7.5 and 1.25% [vol/vol], respectively) to contain maximum GTF activity. At each concentration of apigenin, means labeled with symbols (∗ and δ) are not significantly different from each other at P < 0.05.

