Figure 1.

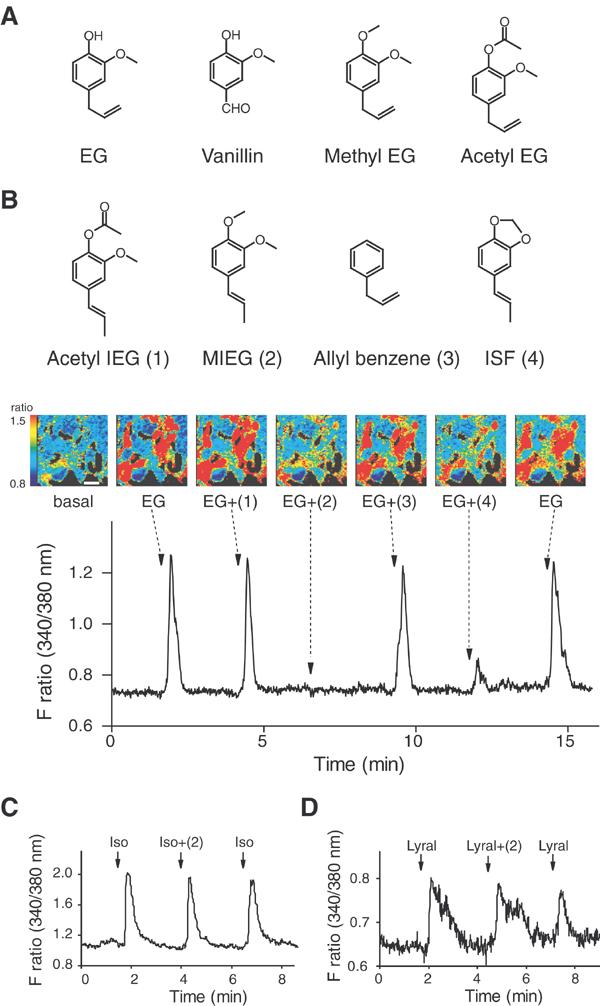
Inhibition of odorant-induced Ca2+ responses by odorants in HEK293 cells. (A) mOR-EG agonists. See Kajiya et al. (2001) for other mOR-EG agonists. EG, eugenol. (B) Inhibition of EG-induced Ca2+ increases in mOR-EG-expressing HEK293 cells by MIEG and ISF. EG (100 μM) was applied for 15 s at the times indicated by arrows with or without various odorants (1 mM) (±(1)–(4)). (Upper panel) Odorant compounds structurally similar to EG that were used for screening. Acetyl IEG (1), acetyl isoeugenol; MIEG (2), methyl isoeugenol; ISF (4), isosafrole. (Middle panel) Pseudocolored images of HEK293 cells at six representative time points of odorant applications. A change in fluorescent ratio intensities before and after application of each stimulus is shown in pseudocolored images, in which red equals the greatest change in fluorescent ratio. Scale bar, 30 μm. (Bottom panel) A representative Ca2+- response profile. (C) Effect of MIEG on isoproterenol-induced Ca2+ increases via endogenous β-adrenergic receptor in HEK293 cells. Isoproterenol (3 μM) was applied for 10 s at the times indicated by arrows with or without 1 mM MIEG (±(2)). (D) Effect of MIEG on lyral-induced Ca2+ increases in MOR23-expressing HEK293 cells. Lyral (1 mM) was applied for 15 s at the times indicated by arrows with or without 1 mM MIEG (±(2)).
