
Figure 4.
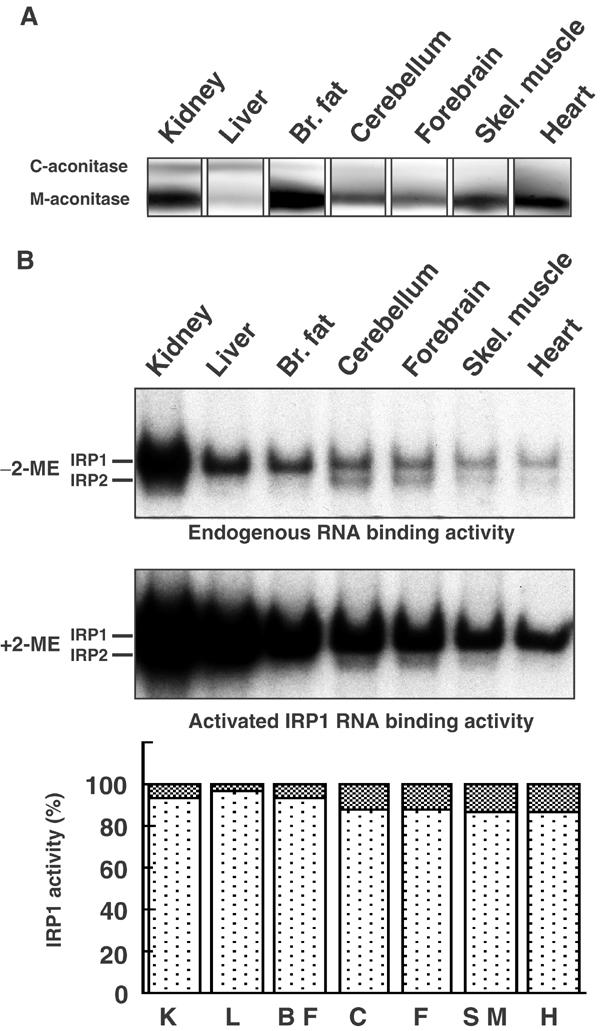
IRP1 activity levels in tissues determined by aconitase and gel retardation assays. (A) Cytosolic and mitochondrial aconitase activities in mouse tissue lysates were assayed after cellulose acetate electrophoresis. Note that relative amounts of the two aconitases vary greatly between tissues and that cytosolic aconitase is mainly detected in the kidney, liver and brown fat. (B) Gel retardation assays of IRPs. Lysates from wt tissues (9 μg protein/lane) were incubated with 32P-IRE and resolved on a 10% nondenaturing gel. Assay without 2-ME reflects IRE-binding activity in vivo (top panel). Assay with 2% 2-ME activates IRP1 that was functionally in a non-IRE-binding state to bind IREs in vitro. A representative example of at least three experiments is shown. In the bottom panel, the small percentage of IRP1 that is in the IRE-binding form is shown as cross-hatched blocks in each column. Notably, 4–18% of IRP1 is in the IRE-binding state prior to 2-ME activation in the seven tissues analyzed. Results shown are representative of three independent experiments.