
Figure 9.
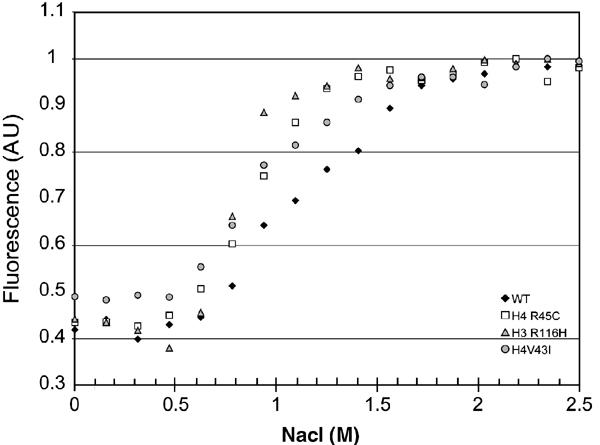
Salt-induced nucleosome dissociation. Loss of tyrosine quenching as a consequence of salt-induced nucleosome dissociation was monitored by following fluorescence emission at 306 nM (excitation 275 nm). Normalized curves are shown. Black diamonds: WT; white squares: NCP H4 Arg-45-Cys; gray triangles: NCP H3 Arg-116-His; gray circles: NCP H4-Val-43-Ile.