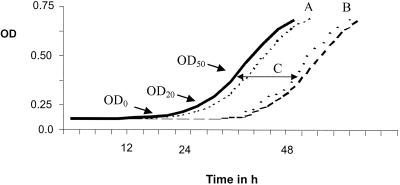
FIG. 1.
Growth curve of control (—) and drug-exposed (---) molds showing PAFE. The mold was grown in RPMI 1640 medium incubated at 37°C during 48 h. Following drug exposure, the curve was shifted to the right when PAFE is present. PAFE was quantified by using OD0, OD20, and OD50. The time needed to reach each criterion for the control was subtracted from that for the drug-exposed conidia (C). PAFE was considered to be present when the upper 95% CI of the control growth curve (A) did not overlap with the lower 95% CI of the drug-exposed-conidia growth curve (B).

