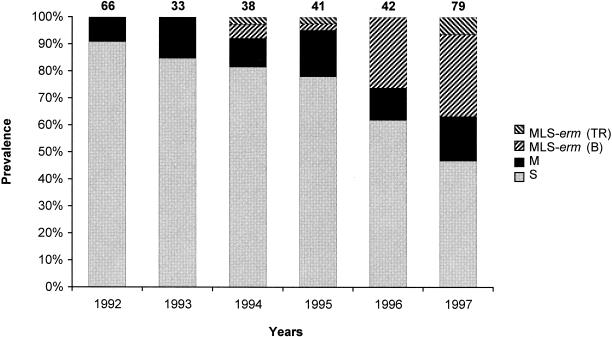
FIG. 1.
Prevalence of macrolide resistance phenotypes and genotypes observed during the study period in the 299 S. pyogenes isolates. S, susceptible phenotype (░⃞); M, M resistance phenotype (▪); MLS-erm(B), MLS resistance phenotype with an erm(B) gene (▨); MLS-erm(TR), MLS resistance phenotype with an erm(TR) gene (▧). The number above each column represents the total number of isolates in the indicated year. The prevalence differences observed during the study period were not significant for the M-type resistant isolates and were statistically significant (P < 0.001) for the MLS-type resistant isolates.

