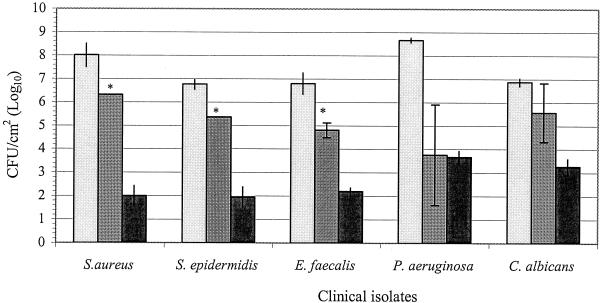
FIG. 3.
Comparison of the efficacies of taurolidine-citrate and heparin against biofilm organisms. The results are expressed as means ± standard deviations (the standard deviations are indicated by error bars). The detection limit was 100 CFU/cm2 (2 logs). Bars with light shading, initial viable counts; bars with medium shading, viable counts for heparin-treated cultures; solid bars, viable counts for taurolidine-citrate-treated cultures; ∗, significant difference (P < 0.05) between taurolidine-citrate and heparin.

