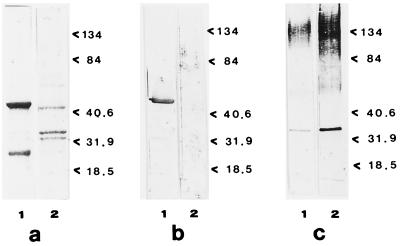
FIG. 2.
Cell wall GAPs of FLC-sensitive strain C. albicans CA2 after staining of the gel with different strains. (a) Electrophoresis on an SDS-10% polyacrylamide gel stained with Coomassie brilliant blue; (b) transblotting onto nitrocellulose paper and reaction with antienolase immune serum (dilution, 1:100); (c) transblotting onto nitrocellulose paper and reaction with ConA-digoxigenin. In all cases, the gels were loaded with 7 μg of protein. Lanes 1, GAP patterns of control cells not treated with FLC; lanes 2, GAP patterns of FLC-treated cells. Molecular mass standards are expressed on the right of each gel (in kilodaltons). For technical details, see Materials and Methods.

