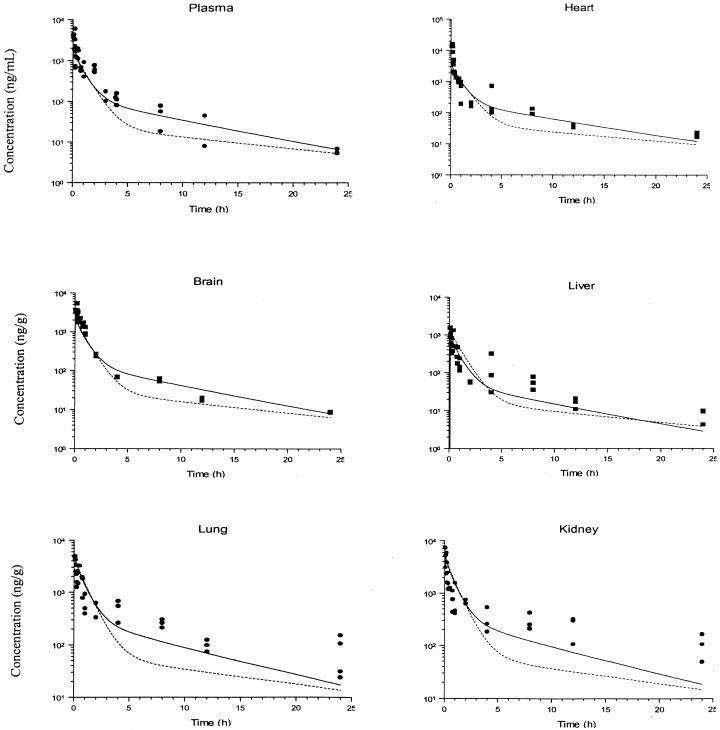
FIG. 2.
Simulated and observed concentration-time profiles for terbinafine in rat plasma and selected tissues after i.v. bolus administration of a 6-mg/kg dose. The solid and dashed lines show the data obtained from simulations with PB-PK models I and II, respectively, and the filled circles and squares indicate the experimental concentration data. The insert plots show the concentration-time profiles in a linear scale up to 10 h.

