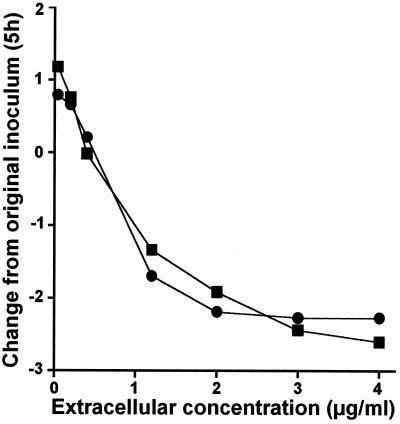
FIG. 6.
Combined data for moxifloxacin from Fig. 2 and 4. The values on the abscissa indicate the actual drug concentration in broth or the macrophage culture fluid. The values on the ordinate indicate the variations in the numbers of CFU per milliliter of broth (closed squares) or per milligram of cell protein (closed circles) after 5 h of incubation. Statistical analysis (analysis of covariance) shows that there were no significant difference between the two sets of data (P = 0.6457).

