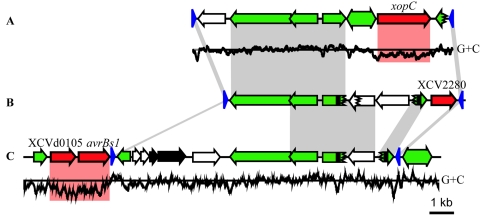
FIG. 3.
Comparison between three effector integron regions of the X. campestris pv. vesicatoria genome. Schematic overview of the chromosomal (A) xopC, (B) XCV2280, and (C) the avrBs1 region on plasmid pXCV183. Gray shaded regions indicate DNA identities of at least 80%, and red marks indicate CDS with low G+C content. Single-headed arrows represent CDS and the direction of transcription. Red arrows refer to putative effector genes. Green CDS are related to mobile genetic elements. Green double-headed arrows represent IS elements, black arrows represent a putative postsegregational killing system, and white arrows represent genes of unknown function. Blue triangles refer to 62-bp inverted repeats. Black rectangles correspond to direct repeats. A jagged line in a CDS indicates frame shifts. The G+C content of the xopC and avrBs1 region was calculated for 100-bp windows (65% on average) and is displayed at the bottom.

