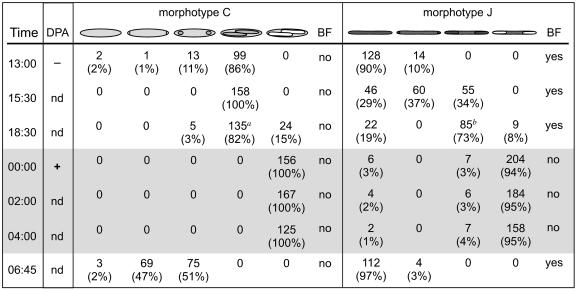
FIG. 2.
Developmental stages seen in C and J morphotype cells collected periodically throughout the day and night. Collection times are shown on the left, followed by DPA assay results, a plus sign indicates DPA was present in the sample, minus is for no DPA, “nd” not determined. Across the top of the chart are drawings representing developmental stages; forespores are shown in dark gray, mature endospores are shown in white. For binary fission (BF) data, “no” indicates binary fission was not observed in the cells surveyed; “yes” indicates binary fission was observed in some cells. Numbers of cells and percentages of total cells counted are provided separately for each morphotype. a indicates the only time point where either rough, phase-bright forespores (in 29 cells) or rope-like DNA in forespores (in 23 cells) was observed for the C morphotype; b indicates the only time where either rough, phase-bright forespores (in 10 cells) or rope-like DNA in forespores (in 28 cells) was observed in J morphotype cells. The shaded part of the chart indicates samples taken from fish held in the dark.

