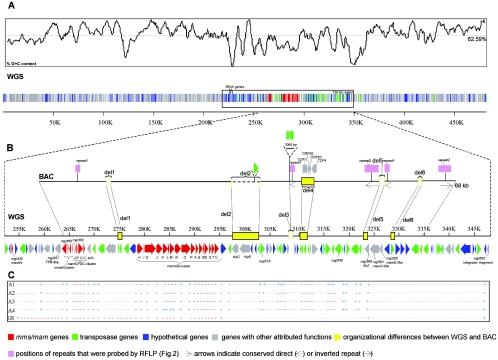
FIG. 1.
(A) Schematic representation of the 482-kb WGS genomic region. Magnetosome genes (mms and mam), hypothetical genes, tRNA genes, genes encoding other assigned functions, and transposase genes are indicated by different colors. The distribution of the G+C content is shown in the upper panel (the average value for the 482-kb region is 62.59%). The extent of the conspicuous 130-kb region described in the text is indicated by a box. (B) Major organizational differences between the BAC sequence and the homologous region in the WGS sequence (del1 to del6). Equivalent positions are connected by lines. The positions of selected features described in the text are indicated. (C) Identified deletions in different type A mutants (A1 to A4) and strain MSR-1B (1B). −, marker absent; +, marker present; dotted line, not tested. The positions refer to the WGS sequence shown in panel B.

