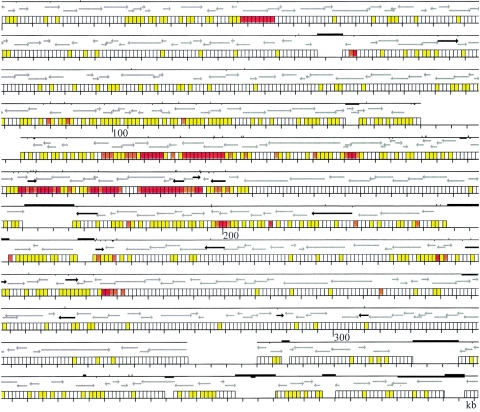
FIG. 4.
Nucleotide variation between strains A and B in relation to the annotation of strain A (10). For each region, three rows are shown. The bottom rows present the scale in kilobases according to strain A divided in windows of 250 bp each for the homologous DNA regions. Zones without windows indicate either interruptions in the concatenated PCR profile (as in Fig. 1) or indels containing more DNA in strain A. The color of each window indicates the extent of nucleotide differences as follows: white, no differences; yellow, 1 to 4 differences; orange, 5 to 10 differences; red, >10 differences. Indels were not counted as nucleotide differences. The middle line rows indicate the open reading frames (ORFs) common to both strains, following the annotation of strain A (10). Gray arrows show ORFs with similar annotations in both strains; black arrows indicate ORFs that correspond to pseudogenes in one of the strains. The top rows show the continuity of the homologous sequence between the two strains and the major genomic rearrangements that interrupt it. The absence of the solid line indicates regions where concatenation of PCR products was interrupted (see Fig. 1). Bars above the line indicate indels where strain A contains more DNA; bars below the line indicate indels where strain B contains more DNA; in this case, the right end of the bar indicates the position of the insertion according to the scale of strain A.

