
FIG. 2.
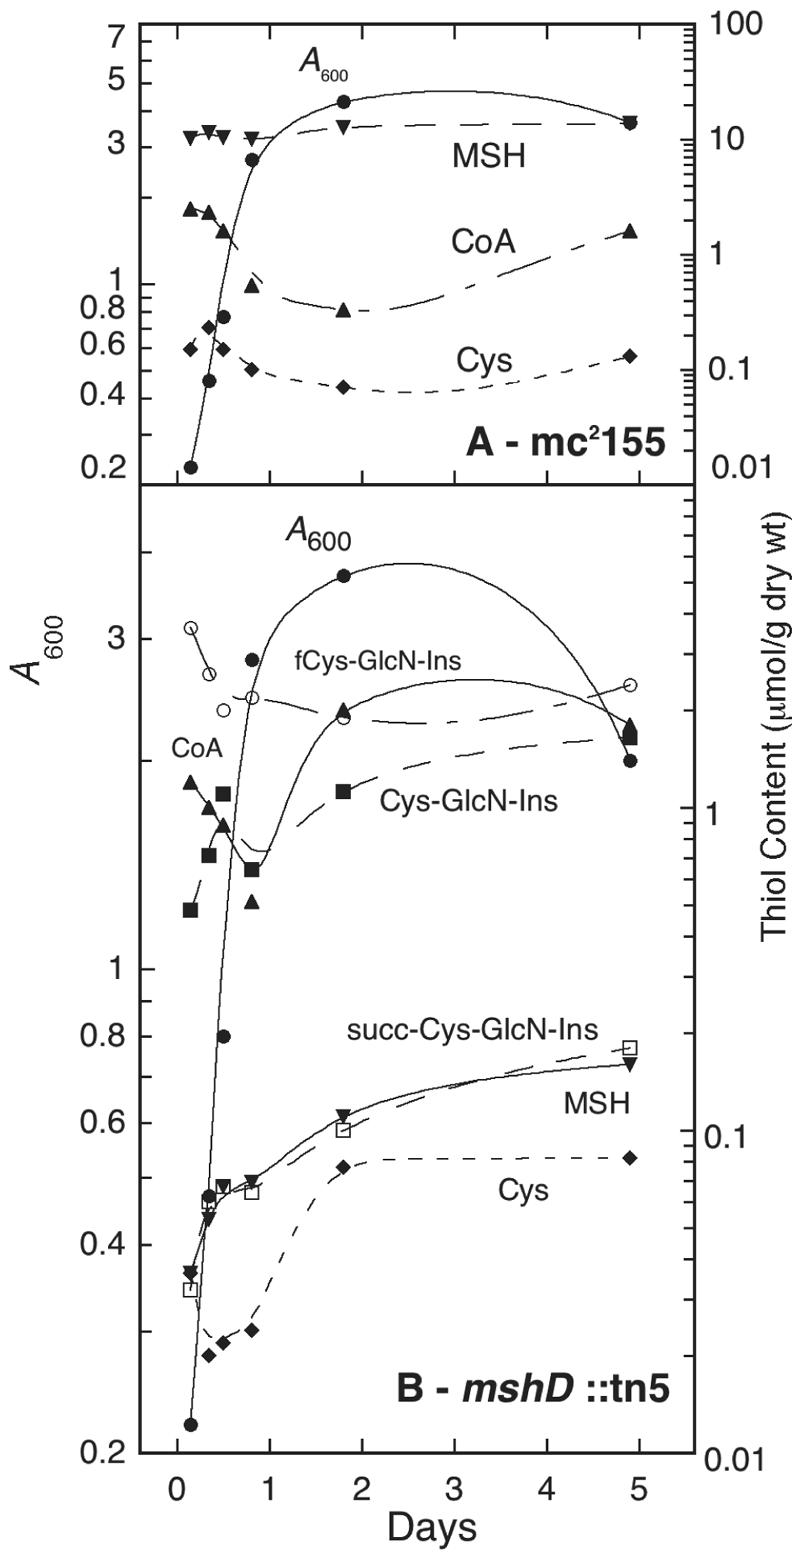
Cellular thiol composition during growth of M. smegmatis mc2155 (A) and M. smegmatis mshD::Tn5 (B). •, A600; ▾, MSH; ▴, CoA; ♦, Cys; ○, fCys-GlcN-Ins; ▪, Cys-GlcN-Ins; □, succ-Cys-GlcN-Ins. Results from two independent cultures are shown; average deviation from mean was ≤20%, except for Cys-GlcN-Ins (where the average deviation was 30%).