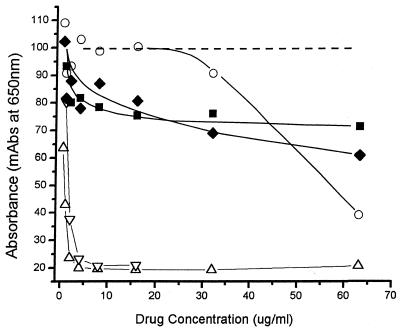
FIG. 3.
Dose-inhibition curves for selected antibiotics against NB. The dashed line represents the curve for positive growth control NB. ▵, is tetracycline; ▿, nitrofurantoin; ○, doxycycline; ▪, vancomycin; ⧫, gentamicin. The negative control is that represented in Fig. 1A. Both tetracycline and nitrofurantoin caused sharp declines in growth until the MIC was reached, with no further growth as the antibiotic concentrations increased. For doxycycline virtually no inhibition was observed until its MIC (62.5 μg/ml) was reached. Vancomycin and gentamicin showed an initial loss of absorbance versus concentration, but this was not sustained over a range of concentrations well above their achievable levels in serum. mAbs, milli-absorbance (10−3 A650).

