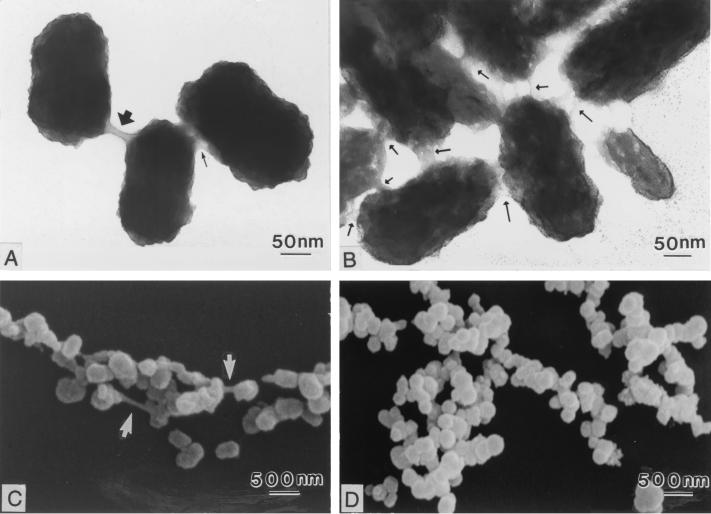
FIG. 5.
Gentamicin-treated NB. Negatively stained TEM micrographs of gentamicin-treated (500 μg/ml, day 14) NB (A) and control NB (B) are shown. Note the larger amount of putative biofilm in the control NB compared to that in the gentamicin-treated NB (arrows). There was a larger amount of clumping in the control NB (D), but there was less clumping in gentamicin-treated NB (C).

