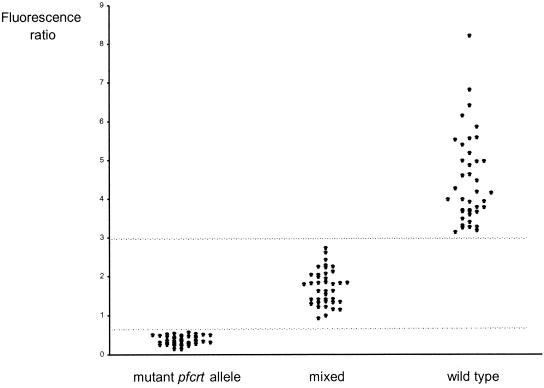
FIG. 1.
Distribution of fluorescence ratios of K76T, mixed K76-K76T, and K76 clinical P. falciparum isolates. Fluorescence ratios express fluorescence measurements at 520 and 590 nm. Data represent the means of three independent experiments; ranges of fluorescence ratios were 0 to 0.09 for wild-type isolates, 0.02 to 0.36 for mixed isolates, and 0.04 to 1.15 (for highest mean value) for mutant isolates. Isolates having fluorescence ratios above 9 are not shown in the figure.

