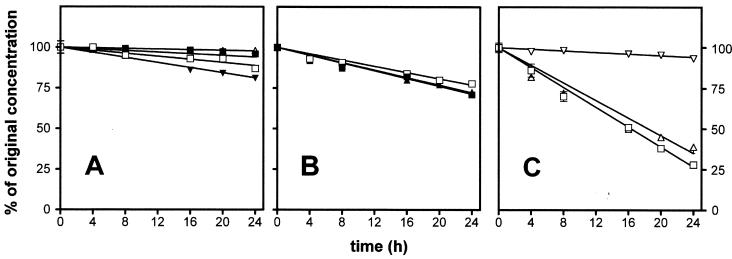
FIG. 1.
Stability of the β-lactams in water at 37°C over time at the maximum concentration tested. (A) Symbols: ▵, 10% aztreonam; □, 12.8% piperacillin; ▪, 12.8% piperacillin plus tazobactam (since the slope for 12.8% azocillin was almost identical to that for piperacillin-tazobactam, it was omitted for the sake of clarity); ▾ 12.8% mezlocillin. (B) Symbols: ▪, 12% ceftazidime; □, 5% cefepime; ▴, 3.2% cefpirome. (C) Symbols: □, 0.8% imipenem plus cilastatin; ▵, 6.4% meropenem; ▿, 6.4% faropenem. All values are the means of three independent determinations ± the standard deviation (SD; symbols without bars indicate values for which the SD is smaller than the symbol size).

