
Figure 3.
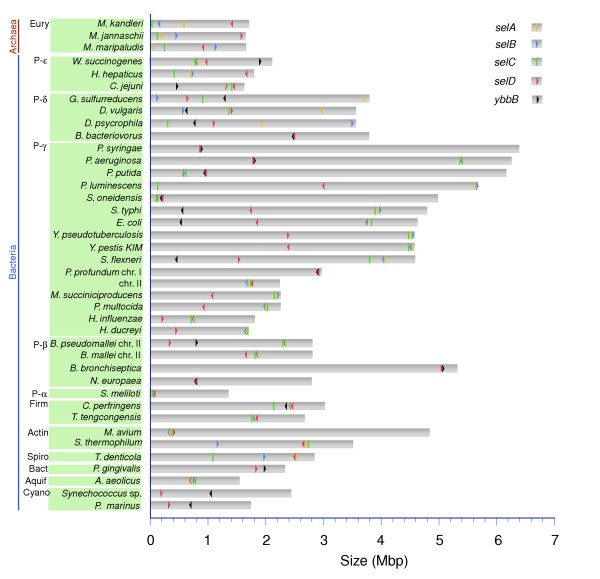
Genome location of selA, selB, selC, selD and ybbB. Each bar represents one replicon of a species. On the vertical axis the species name, phylum, and domain are specified. The horizontal axis corresponds to the replicon size. Location of selA (yellow), selB (blue), selC (green), selD (red) and ybbB (black) is indicated; arrows denote direction of transcription.