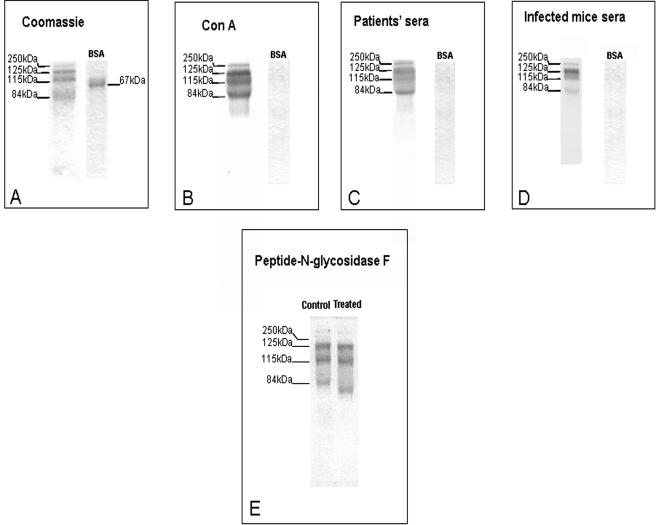
FIG. 3.
SDS-PAGE and Western blot analysis of DEAE peak 3. Material (2 μg) from peak 3 was run in 12% polyacrylamide gels and stained with Coomassie (A). Proteins resolved by electrophoresis were also transferred to nitrocellulose membranes and incubated with biotin-conjugated ConA (B) with a pool of sera from patients (C) or with a pool of sera from experimentally infected mice (D). BSA was included as a control. Panel E shows the effects of PNGase F on material from peak 3 using immunoblotting with a pool of sera from patients. To obtain a better resolution of the bands of interest, this gel was run for longer than usual (5 versus 2 h), which explains the different band pattern in this panel relative to the other panels. Pooled human and murine sera were used at a dilution of 1:100 in TTBS. Numbers on the left indicate the molecular masses in kilodaltons.

