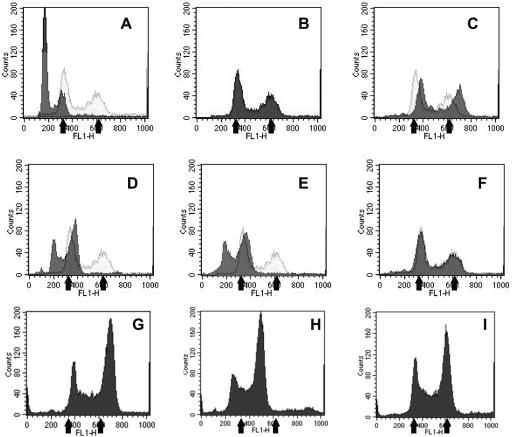
FIG. 2.
Flow-cytometric analysis of cells isolated from the diploid-tetraploid competition and from single-tetraploid infection. The panels show the DNA content of cells from colonies isolated from mouse kidneys. The fluorescence peak for G1 diploid cells is at 160 units and for G2 cells is at 320 units. For tetraploids the corresponding peaks are at 350 and 620 units (black arrows). A to F. Colonies from the competition experiment. A. AF27 preinoculation (MC3). B. 4450 preinoculation (MC4). C. 2-dG-sensitive cells (6 days, MC26). D. 2-dG-resistant cells (8 days, MC28). E. 2-dG-sensitive cells (8 days, MC29). F. 2-dG-sensitive cells (8 days, MC12). The preinoculum 4450 trace is superimposed on panels A and C to F. The MC numbers refer to strains in Table 4. G to I. Colonies from a single infection with tetraploid 3834.

