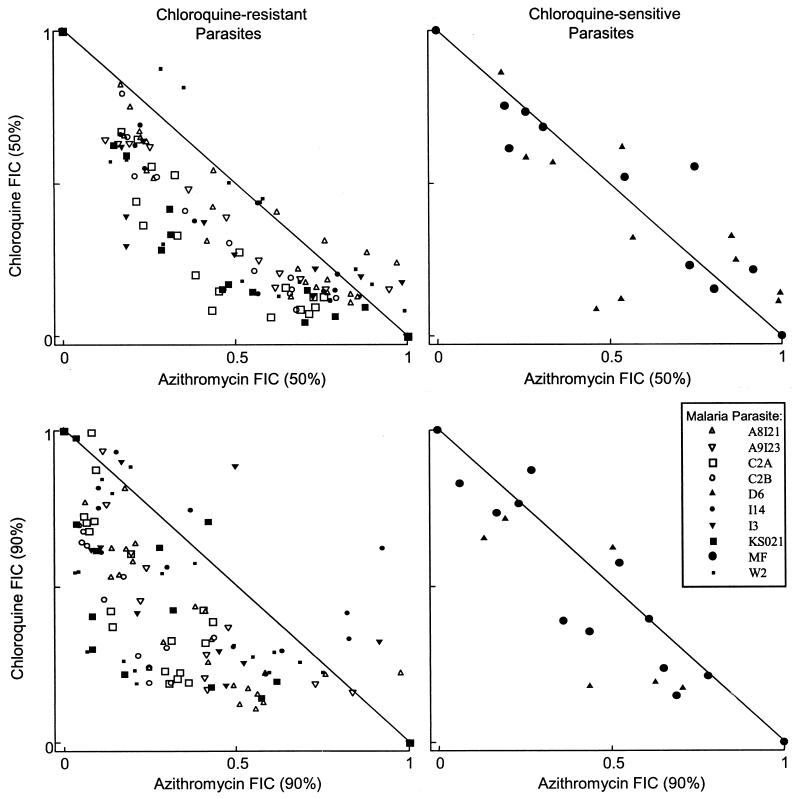
FIG. 1.
Azithromycin and chloroquine FIC50s and FIC90s at various concentration ratios. All data points from successful assays are presented. Isobolograms can be visually fit through the data points. A concave isobologram is consistent with synergy, a convex one is consistent with antagonism, and a straight line is consistent with additivity. Axes are IC50s and IC90s normalized to 1.

