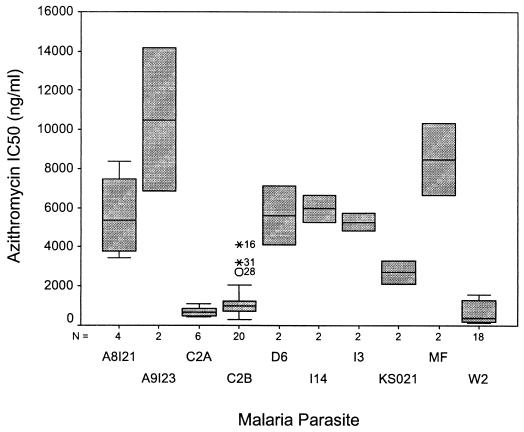
FIG. 2.
Azithromycin sensitivity of parasites. Boxes represent the interquartile range, and error bars represent the range. Error bars are not present for some boxes because only two isolates are represented (see number of isolates indicated below the x axis). Data points outside of the range represent outliers.

