
Figure 2.
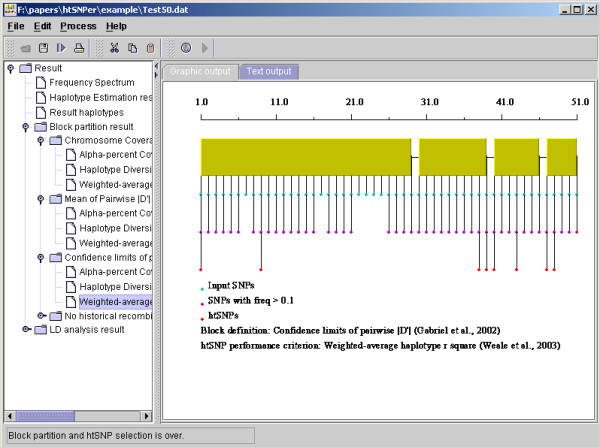
Sample output from htSNPer1.0. The first line showed the SNPs index, and could be replaced by the SNPs coordinate in its input. The brown color blocks represent the haplotype block structure in this region. Three classes of dots represent the input SNPs, the SNPs over a threshold (e.g., 0.10; defined in the optional dialogue), and the htSNPs, respectively.