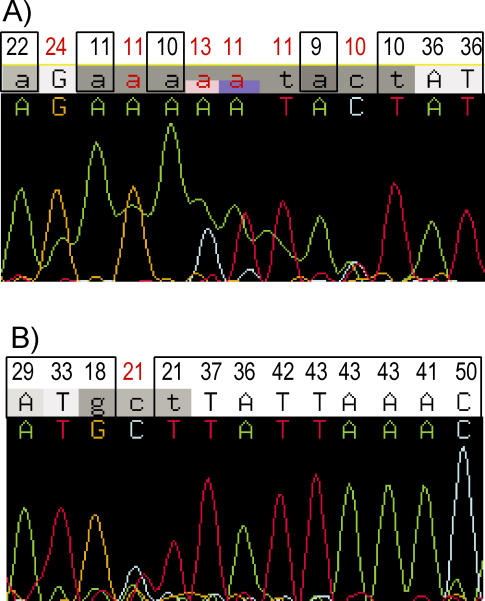
Figure 2. Rejected and Accepted Bases in a Sequence Trace.
The Phred quality scores are indicated at the top. The quality scores for rejected bases are labeled in red. Accepted bases are marked by rectangular boxes.
(A) A subregion of polyA bubble showing that low-quality bases with no secondary peaks are accepted by SNPdetector.
(B) A subregion showing that a Q20 base is rejected because of its high secondary peak even though the majority of neighboring bases have high-quality scores.

