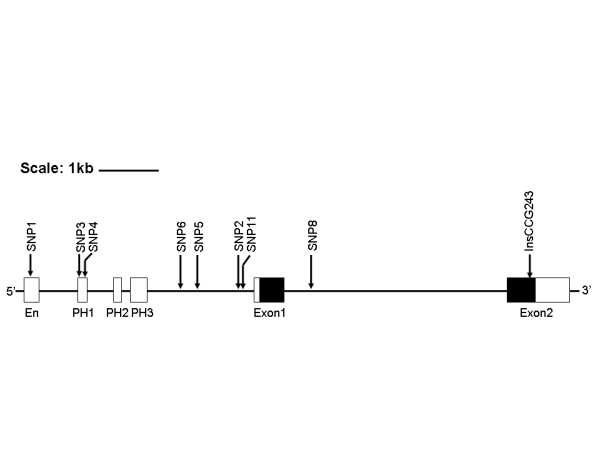
Figure 1.

Map of the IFP1 gene and upstream regulatory regions. Upstream regulatory regions are shown in white boxes. Exons are shown in boxes; translated regions are black and the untranslated regions are grey. The approximate locations of each SNP and the CCG (proline) insertion polymorphism are shown. Lines with arrow heads show the areas covered for PCR/DHPLC screening.
