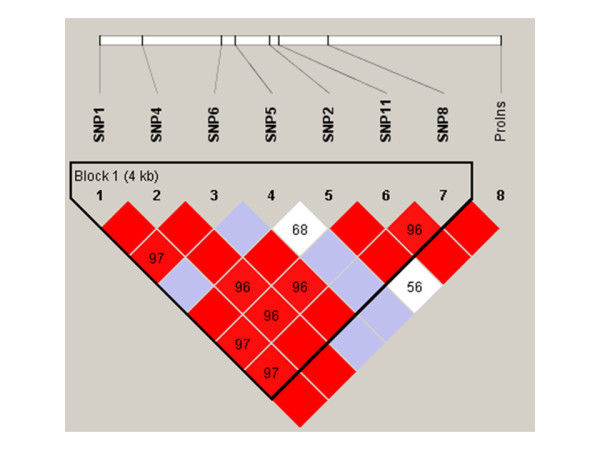
Figure 2.

Linkage disequilibrium (D') plot of the IPF1 gene in African American subjects. SNPs are shown by location as in Table 1 and Figure 1. Squares without numbers represent D' values of 1.0; all numbers represent the D' value expressed as a percentile. Red squares represent pairs with LOD score for linkage disequilibrium of ≥ 2, blue squares represent D' = 1 but LOD<2, and white squares represent LOD<2 and D'<1.0. Plots were generated using HaploView v3.2.
