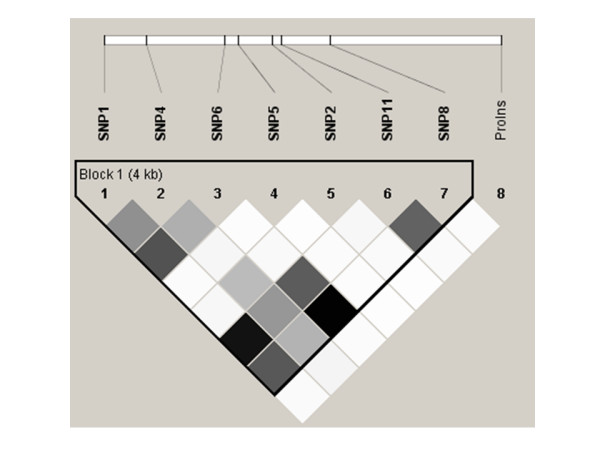
Figure 4.

Linkage disequilibrium (r2) plot for in African Americans. Figure 4 is analogous to the D' plots shown in Figure 2. The r2 value is shown on a grey scale, where white represents r2 = 0, black represents r2 = 1, and shades of grey represent 0<r2<1. All plots were generated using HaploView v3.2. SNP names and locations are as in Figure 2.
