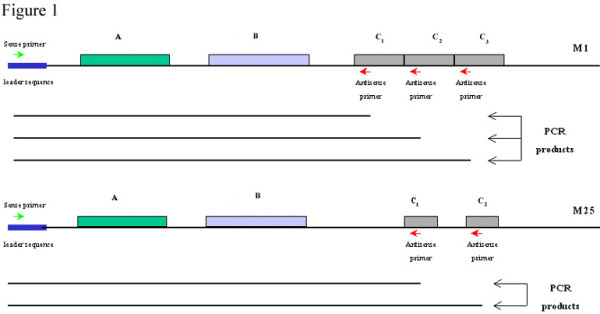
Figure 1.

Diagrammatic representation of the emm1 and emm25 genes of M1 and M25 proteins, respectively, showing the different A-, B- and C-repeat regions encoding the M protein. The location of the sense and antisense primers used for PCR amplification of the emm gene are indicated as well as the different emm gene amplicons (PCR products) that arise depending upon the number of C-repeat regions within the emm gene.
