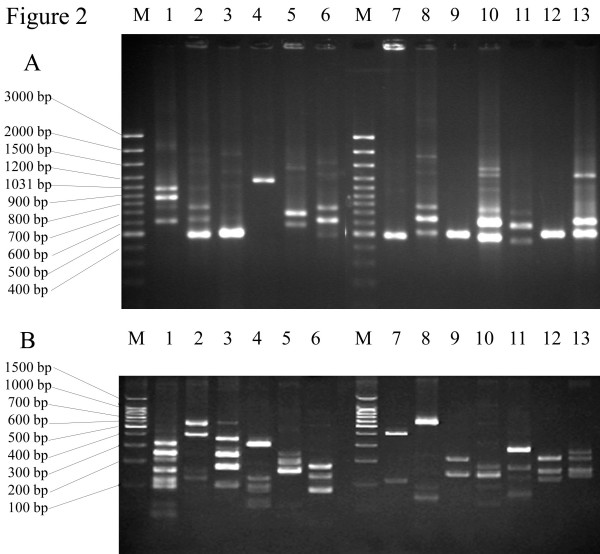
Figure 2.

Agarose gel electrophoresis of emm gene amplicon PCR products (A), and polyacrylamide gel electrophoresis RFLP patterns using Alu I restriction enzyme (B). The size differences of PCR products and RFLP patterns of M1, M11, M49, M12, M25, M48, M112, st11014, M44/61, M93, M81, M104 and M66 are shown in lanes 1–13, respectively. Lane M represents a 100 bp ladder.
