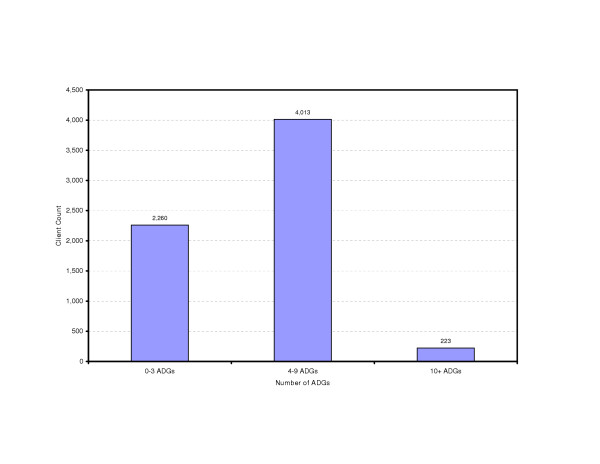
Figure 3.
Percent of Clients by Number of ADGs, Downtown Core Area, fiscal year 2001/2002. The study population, identified and extracted through HGIS, is further analyzed through the Johns Hopkins ACG system. The number of ADGs (Adjusted Diagnostic Group) per capita is a method of describing the co-morbidity of a population. This figure indicates that 223 clients out of the study population (6,479 in total) have 10 or more reported health conditions, while majority of them (4,013) possesses 4–9 co-morbidities.

