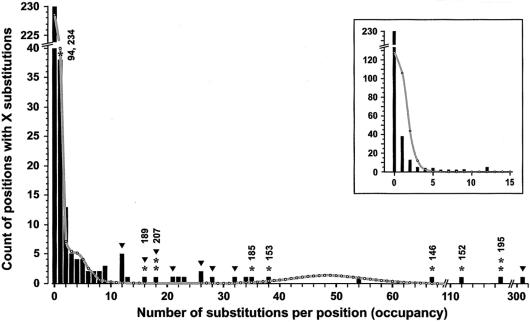
Figure 3.
Substitution-density distribution among the sites in 650 European HVII sequences (HVII being delimited by positions 58–370). The mean mutation density used to draw the theoretical curve for the fast sites was 48.9, and their number was assumed to be 22 (according to table 2). The meaning of the bars, asterisks, numbers, and triangles is the same as in figure 2. Inset shows the low-occupancy sites (bars) and a theoretical curve generated according to a single-rate model (eq. [3]) using a cumulative substitution density of the sites up to X=12.

