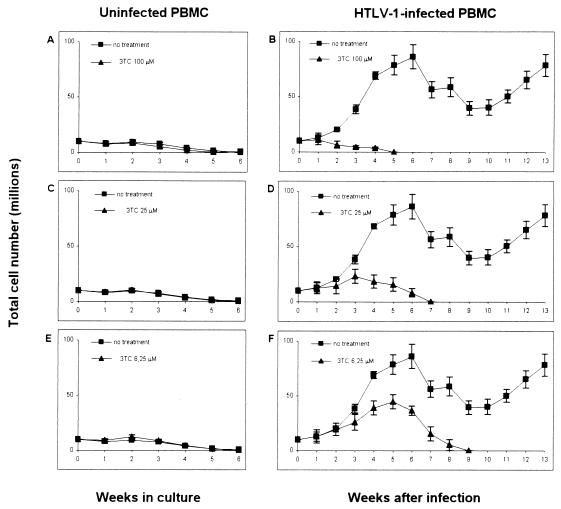
FIG. 3.
Growth curves of uninfected PBMC (A, C, and E) and HTLV-1 infected PBMC (B, D, and F) in the presence of different concentrations of 3TC. Each experimental point represents the mean TCN ± SD determined weekly in cultures from three different experiments using PBMC from three donors. The growth curve of untreated cultures is reported in all graphs, for visual comparison. By one-way analysis of variance, significant differences in HTLV-1-infected PBMC among groups were determined starting by week 3, while no differences in uninfected PBMC among groups were found at any times tested.

