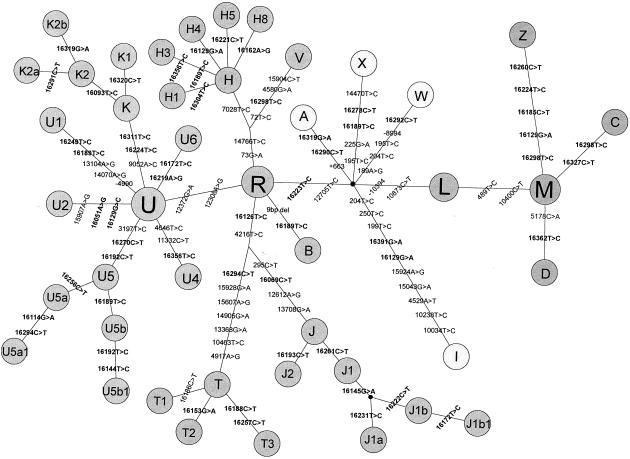
Figure 2.
Schematic phylogenetic representation of mtDNA lineage clusters found in European populations, reconstructed on the basis of information obtained from Torroni et al. (1996), Richards et al. (1998), Macaulay et al. (1999), Quintana-Murci et al. (1999), and Helgason et al. (2000b). Lineage clusters are shown as circles, and the connecting lines represent diagnostic substitutions.

