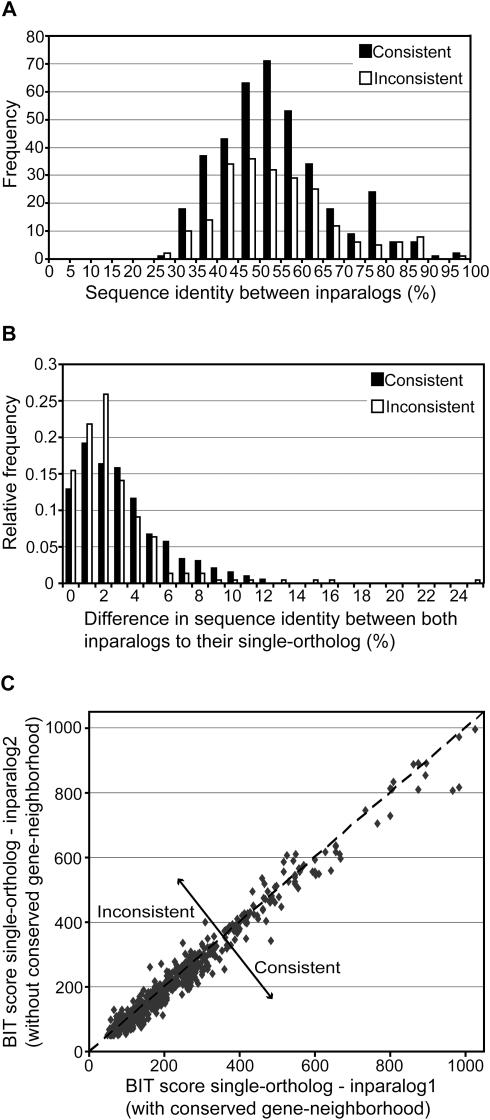
Figure 5.
Sequence identity analysis between inparalogs. All plots are constructed from the total genome-comparison dataset, including Gram-positive bacteria, Proteobacteria and Archaea. (A) Frequency of consistent (most similar inparalog has a conserved gene-neighborhood) and inconsistent cases (less similar inparalog has a conserved gene-neighborhood) at different levels of sequence identity between inparalogs. Nine co-ortholog groups were found in which the inparalogs show 100% sequence identity. These are not included in this plot, because both inparalogs are in fact BBHs. Therefore, a consistency or inconsistency, as defined, cannot be determined. (B) Relative frequency of consistent and inconsistent cases at different levels of sequence identity difference between inparalogs to their single-ortholog. The sequence identity difference is calculated by subtracting the percentage of sequence identity between the BBH and the SBH. (C) Sequence similarity, expressed in BIT scores, between the single-ortholog and both inparalogs. The inparalog which is located in a conserved gene-neighborhood is plotted on the X-axis. Therefore, the consistencies are positioned underneath the line y = x.

