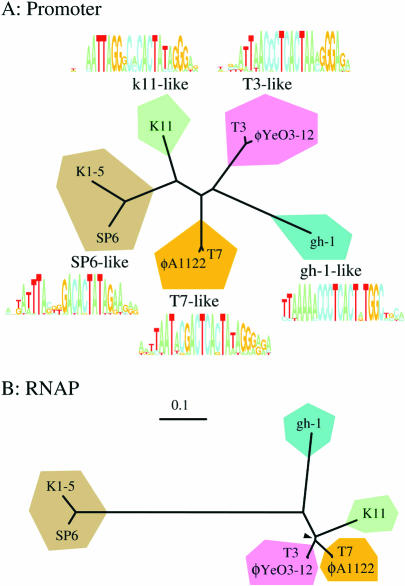
Figure 7.
Phylogenetic analysis of the T7-like promoter models and the RNAPs from the eight T7 group phages. (A) Distances among different promoter models were calculated by the program diffribl using Zhang's method. The resulting distance matrix was used to generate the tree by the programs neighbor and drawtree. Individual and combined sequence logos are shown for comparison. (B) An unrooted tree of the eight RNAP protein sequences was constructed using the programs protdist and neighbor from the PHYLIP 3.6a3 package (42). All nodes have 100% bootstrap support except for one which is 80% (indicated by a black triangle). The two trees in (A) and (B) were normalized, so the scale bar applies to both trees and represents 10% of respective total branch length.

