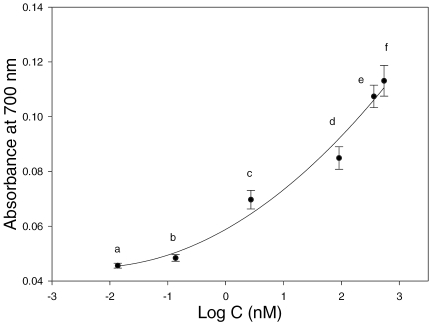
Figure 4.
Quantitative analysis of the target gene concentration using UV-vis spectrophotometry. The experiment condition was described in Materials and Methods. The standard deviations obtained by five repeated measurements were shown as the error bars. The signal-to-noise ratio for data points a, b, c, d, e and f is 50.7, 40.3, 20.5, 20.7, 26.2 and 20.2, respectively.

