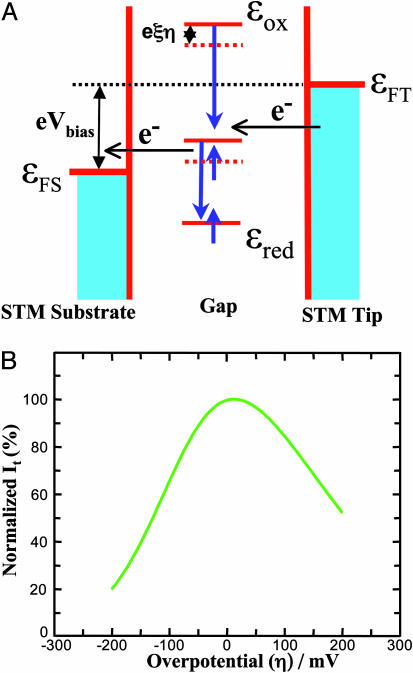
Fig. 5.
Theoretical analysis and computation. (A) Schematic energy diagram of the ECSTM showing the relative energy levels of the substrate, the tip, and the redox molecule. εFS and εFT denote the Fermi levels of the substrate and the tip, respectively; the energy levels of the redox molecule at the oxidized and reduced forms are represented by εox and εred, respectively. (B) Dependence of STM tunneling current on the overpotential calculated by Eqs. 1-3 (see the text) with ρt = 0.42 and ρs = 0.29 number of states·eV–1·atom–1, αt = αs = 0.5, Vbias =–0.2 V, Er = 0.45 eV, κS = 0.1, κt = 0.01, ξ = 0.7, γ = 0.20, θ = 5.6 eV–1, ωeff = 1013, T = 295 K, and other parameters with their normal values. The tunneling current is normalized relative to the maximum value.

