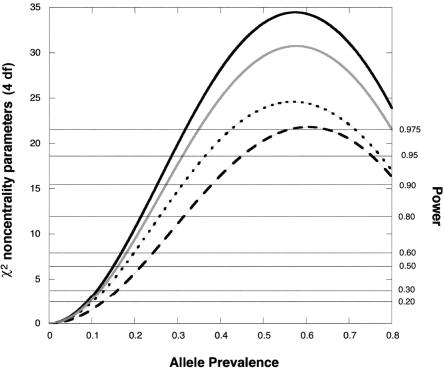
Figure 2.
χ2 noncentrality parameters for a likelihood-ratio test of the four genetic risk parameters based on a scenario with an offspring-mediated recessive effect (R1=1, R2=3) and no maternally mediated effects (S1=1=S2). The calculations assume Hardy-Weinberg equilibrium and use 150 cases for each design. To calculate corresponding noncentrality parameters for a different number, N, of cases, multiply the value shown by N/150. Solid dark curve, hybrid design (Hybrid MS and MA analyses coincide when there are no maternal effects), five individuals genotyped per case. Solid light curve, Epstein et al. (2005) design, four individuals genotyped per case. Dotted curve, case-parents design, three individuals genotyped per case. Dashed curve, case-mother/control-mother design, four individuals genotyped per case. Horizontal reference lines indicate power at α=0.05.

